Are the most attractive jumps foals really the best racing prospects?
Breeder Bryan Mayoh investigates whether looks matter and finds a surprise
This article was first published in January 2019
At every sale of unraced jumps horses, be they foals, yearlings or stores, two principal factors drive the prices paid – the pedigree of the horse and whether or not it appeals to prospective buyers in appearance, conformation, temperament and movement.
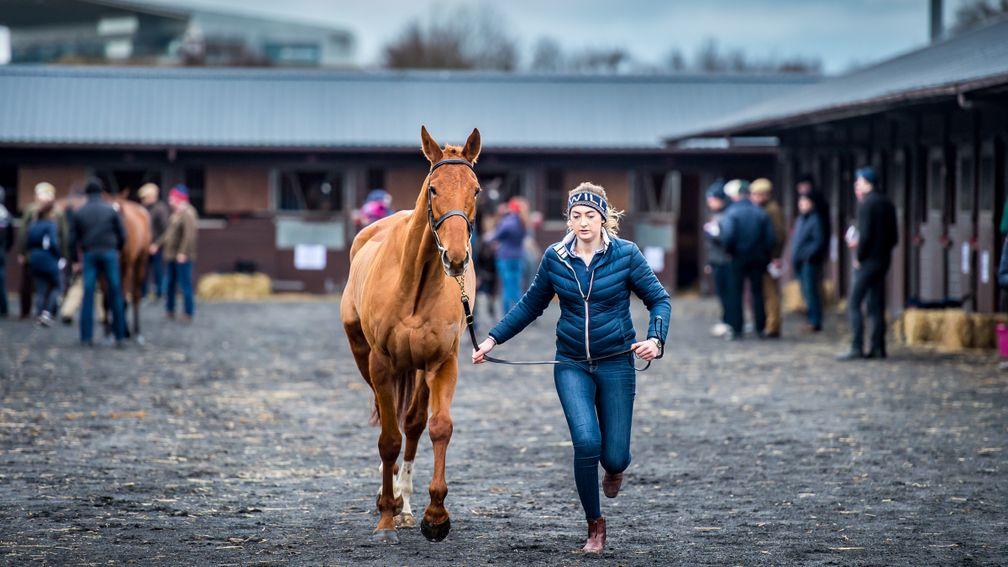
Horses are pulled out and then scrutinised side-on, front-on and from behind; they are then walked and trotted before judgements worth many thousands of pounds are made in less time than the average race takes to run.
It can be fascinating to observe the various ‘experts’ in action, each seeking to spot some factor their rivals have failed to notice which might justify an extra bid or two on a horse who might one day demonstrate the purchaser’s expertise by winning a major race.
Over the years I have watched numerous such examinations and studied the prices made by countless horses, wondering why this foal brought a high price and that one, with an apparently better pedigree, a much lower sum.
In doing this, one key question has constantly come to mind: are the foals who bring much higher prices than you might expect from their pedigrees any more likely to be successful than the ones who bring much lower prices?
Basically, is all this effort worthwhile?
One day, with the horses mucked out, the TV racing of no real interest and nothing better to do, I decided to find out.
The way I did this was to look at which foals from a sale several years ago brought much higher prices than one would expect of their pedigrees, and which ones much lower prices, and then look at whether the first group turned out to be better racehorses than the second. Of course, the tricky part is deciding how much one might expect each foal to bring in the first place, based purely on its pedigree.
Assessing prices versus pedigrees: the boring bit
Several years ago I found that a simple but reliable guide to jumps foal prices is the varying evidence of racing or producing class in the first three dams.
If the dam was herself a black type (BT) winner or the producer of such, then the foal’s pedigree might be regarded as Category 1. If the dam was BT-placed or producer of a BT-placed horse, or the granddam was a BT winner or producer of a BT winner, then the foal’s pedigree would be Category 2. Here, horses qualifying via both dam and granddam would be Category 2a; those qualifying through only one of these would be Category 2b.
If the dam was merely a winner or producer of a winner, or the granddam was herself BT-placed or producer of a BT-placed horse, or the third dam was a BT winner or producer of a BT winner, the foal’s pedigree would be Category 3. Category 3a represents foals qualifying via each of the first three dams; 3b those qualifying via only two; and 3c those qualifying via only one.
If none of these is the case, the foal’s pedigree would be Category 4.
I have long used this methodology to assess broodmares and found it gives a good guide to their valuation, since it also gives a pretty good guide to the valuation of their foals.
For the sales used in my analysis, the median prices for colt foals were:
Category 1 €28,000
Category 2a €11,500
Category 2b €7,000
Category 3a €6,200
Category 3b €4,400
Category 3c €3,000
Category 4 €2,700
Of course, the appeal of the stallion plays a major part too, with particular stallions being more or less likely to produce prices above or below these guidelines. To allow for this I calculated the difference between the price realised for each foal compared with the median price for its category, and then ranked the foals for each individual stallion in order of this difference.
One would expect to find the most attractive foals at the top of each list and the least attractive ones at the bottom. All foals in the top 25 per cent of a stallion’s progeny in terms of this price difference (for stallions with at least four sold) were then compared with those in the bottom 25 per cent.
What the racing results revealed: the interesting bit
The foal sales I chose to analyse were for the crop of 2010 for the simple reason that these were the earliest sales for which I had already analysed pedigrees and prices, so having the key data available. The additional work required was to assess the subsequent racing records of these foals, looking only at colts because these offer the necessary sample sizes.
Considering only foals who were recorded as sold, but not to vendors, 501 foals were found, of which 99 fell into each of the top and bottom quartiles by price realised, versus price expected for each stallion.
Referring to these two groups as ‘A’ and ‘B’, then the ‘A’ group represents foals who were particularly attractive to purchasers, probably on account of their looks, movement and temperament, and the ‘B’ group the least attractive. The results are . . .
Well, first, please allow me to say at this juncture that I was rather hoping to find minimal differences in outcomes for the two groups, at which I might have trumpeted that all the scrutiny and examination of foals, along with the walking and trotting and umming and aahing, are futile – the best-looking foals are really no better than the worst.
Had this been the case, I might have suggested a nicely controversial headline, such as 'Trying to deduce racing ability by looking at jumps foals is pointless says Mayoh'.
I would probably also have tried to avoid irritating foal buyers the week before I am selling foals by timing the article to give adequate time for it to be forgotten before the next sale.
But no more dissembling: the results to date (with these foals now having reached the age of nine) speak for themselves.
Group A: the top 25 per cent
Number 99
Raced 77 (78%)
Winners 45 (46%)
BT winners 11 (11%)
G1 winners 6 (6.1%)
Average RPR 103.8
No. rated 140+ 21 (21%)
Group B: the bottom 25 per cent
Number 99
Raced 67 (68%)
Winners 31 (31%)
BT winners 5 (5%)
G1 winners 1 (1%)
Average RPR 88.2
No. rated 140+ 9 (9%)
The colts whose prices indicated that they were the most attractive specimens produced a higher proportion of horses who raced, more winners, more than twice as many black-type winners, and six-times more Grade 1 winners.
The average of their highest RPRs was almost 16lb above those of the ‘least attractive’ group, with twice as many reaching the level of 140 that indicates a high-class performer. So the buyers of 2010 foals generally did a good job in picking the best ones.
This becomes even more evident when you look at actual horses. The top two horses in the Group A foals whose prices outdid their pedigrees were later named Native River and Sizing John, the last two winners of the Cheltenham Gold Cup.
The third top horse was dual Cheltenham Festival Grade 1 winner Yorkhill. The highest-rated horse from Group B was the 164-rated Different Gravey – an appropriate term to describe their racing results.
The roll of honour of buyers of Grade 1 winners from Group A comprises John Dineen (Native River), John Bleahen (Sizing John), Ian Ferguson (Yorkhill), Aiden Murphy, Liz Lucas and Agence Fips.
The lone hero to spot one among the ‘less desirable’ specimens was young JJ, son of Dick Frisby.
All of this appears to demonstrate a simple truth in answer to the question posed by the headline to this article: the best-looking, best-conformed and best-moving jumps foals really are the best racing prospects.
If you enjoyed this story you may also be interested in...
A look at the names and numbers behind 2018's blockbuster point-to-point sales
A reconnaissance mission to learn the secrets of France's best jumps breeder
Published on inFeatures
Last updated
- 'This latest season has underlined his status as a breed-shaping sire' - Tony Morris's take on the 2024 European Pattern
- Broken glass and burst blood vessels at a totes emosh renewal of the December Foal Sale
- All work and no play makes James a dull boy at the Goffs November Sale
- Highs, lows and my Serbian counterpart provide a stern test of sales reporting stamina
- A glitch in the bloodstock matrix as Coolmore throw shade, Mangan messes with my dinner plans and a new master of sales ring satire emerges